How to Read Candlesticks
Candlestick is a basic element of a crypto chart used in technical analysis. Candlestick patterns help to understand current trends, market sentiment, further price movements and trading opportunities. The article describes candlestick design and shows the most common bullish and bearish candlestick patterns.

What Are Candlesticks in Crypto?
Candlestick shows a crypto asset's price fluctuations during a specific timeframe. It consists of a body and wicks. The top and bottom of the body indicate the opening and closing prices. Wicks show the highest and the lowest price points. Look at the picture below to better understand a candlestick's anatomy. Bullish candlestick has a green body, and bearish has a red one.
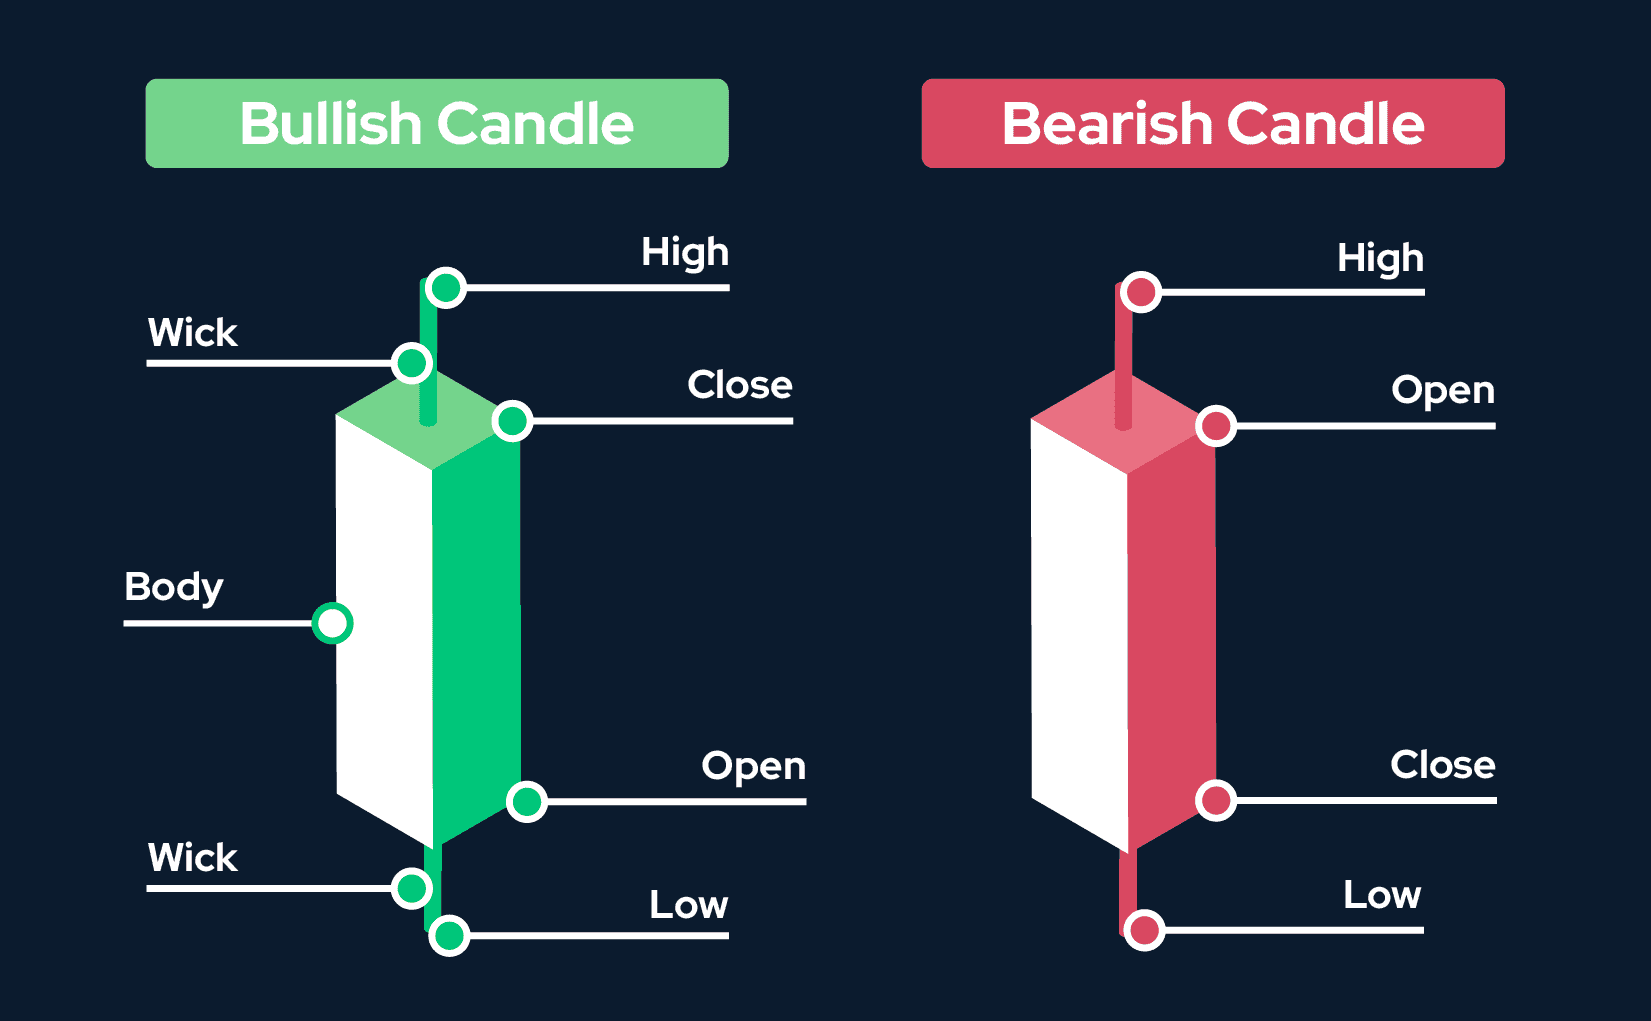
By analyzing candlesticks, one can gain valuable information about price movements, such as the distance between the closing price and the highest point during a given period or the level of volatility exhibited by an asset during specific trading points.
Bullish Candlestick Patterns
A bullish candlestick pattern appears following a string of price drops and before a sequence of price boosts.
Hammer
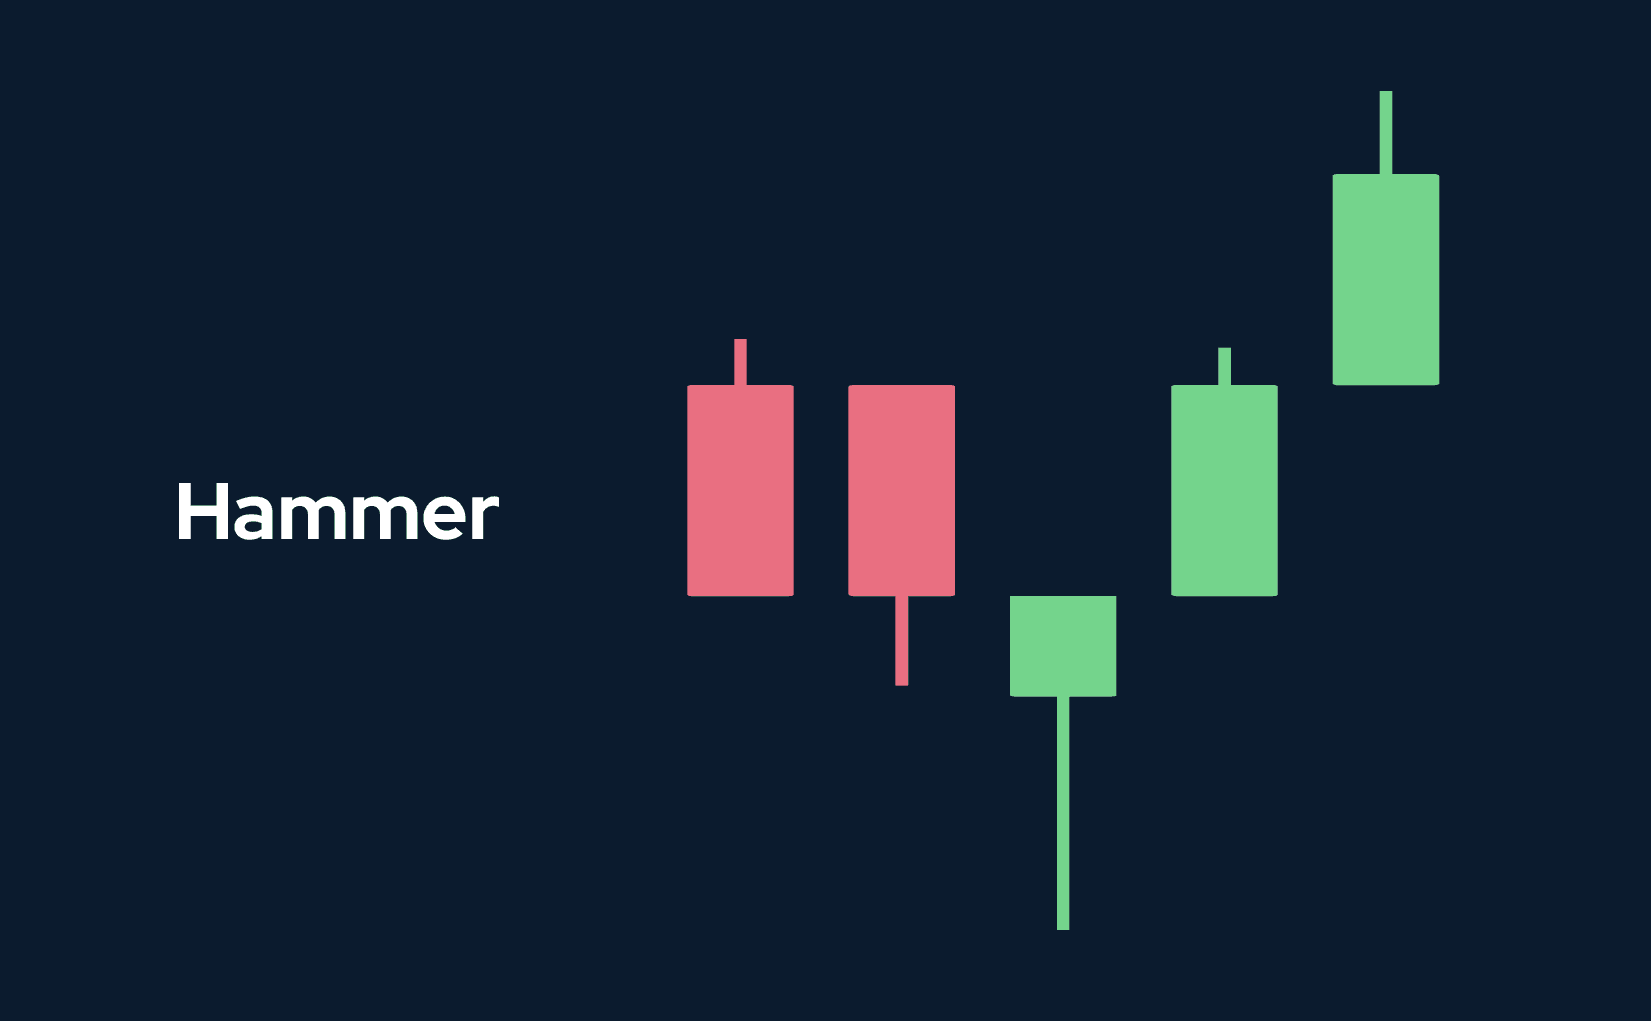
A hammer is a candlestick that appears during a downtrend, with a long lower wick at least twice the size of the candle body.
The presence of a hammer indicates that even though there was significant selling pressure, the bulls managed to drive the price back up to close near the starting point.
Inverted hammer
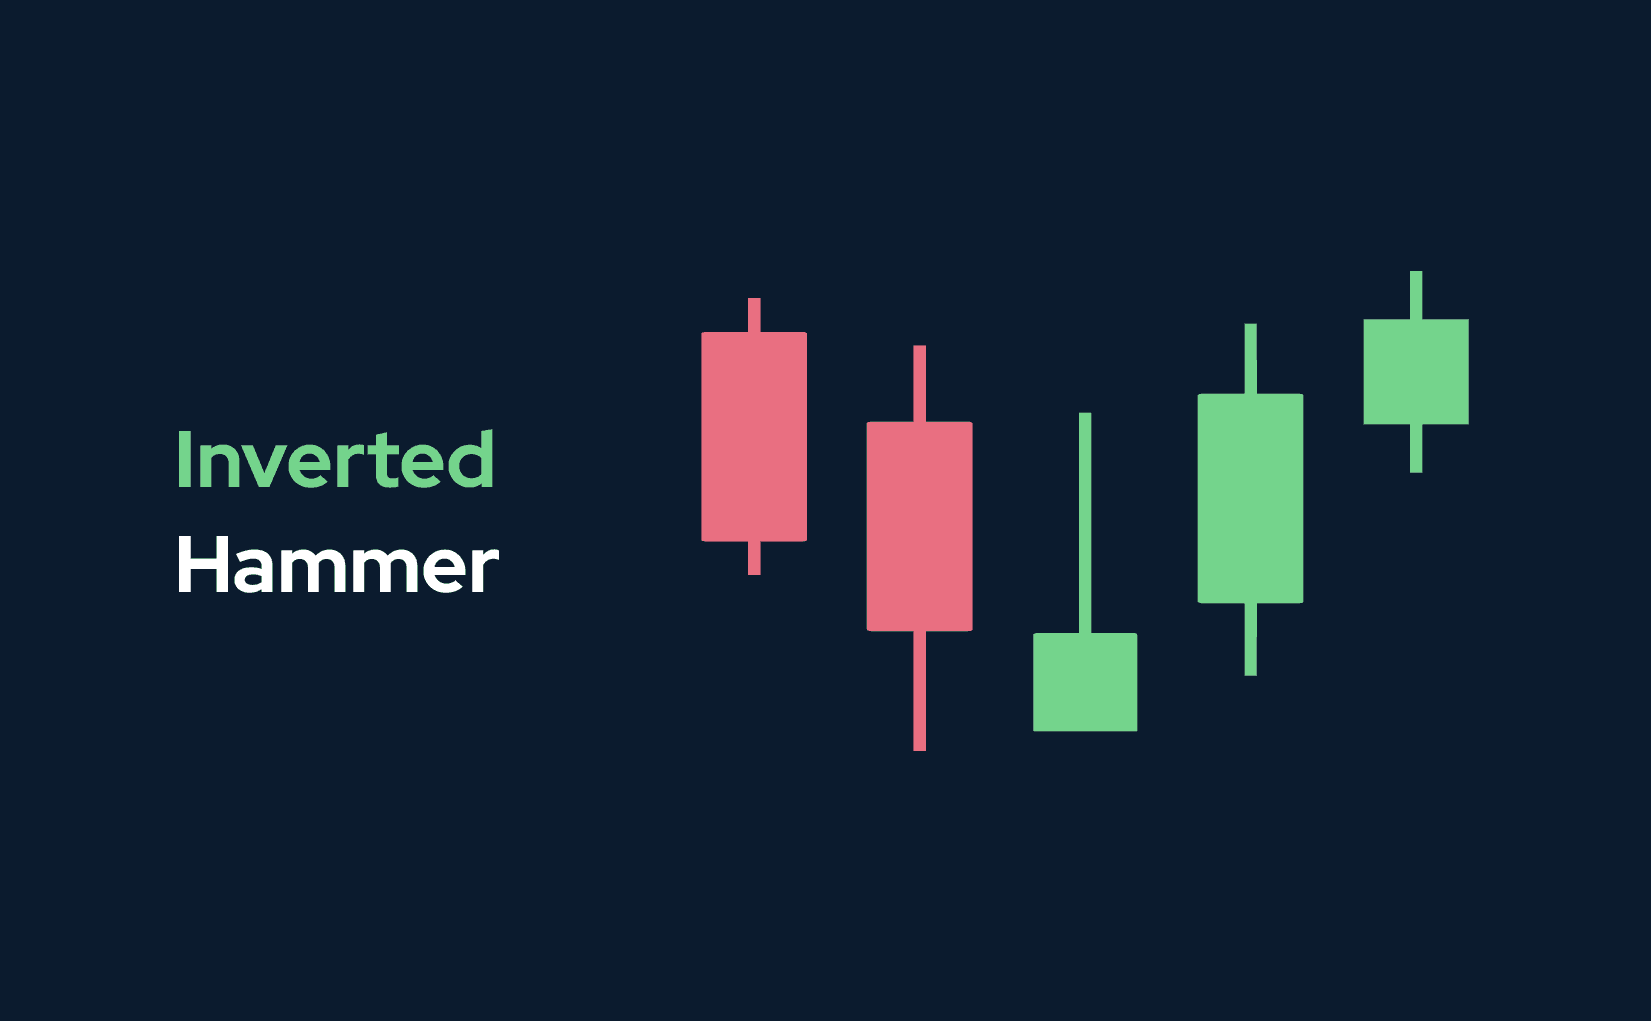
In an inverted hammer, we see a long upper wick instead of a bottom one, which should also be at least twice the size of the candle body.
An inverted hammer appears at the bottom of a downtrend. The presence of an upper wick suggests that the price has ceased its downward trend, despite attempts by sellers to bring it close to the initial value. The inverted hammer pattern could suggest buyers will likely gain market control soon.
Three white soldiers
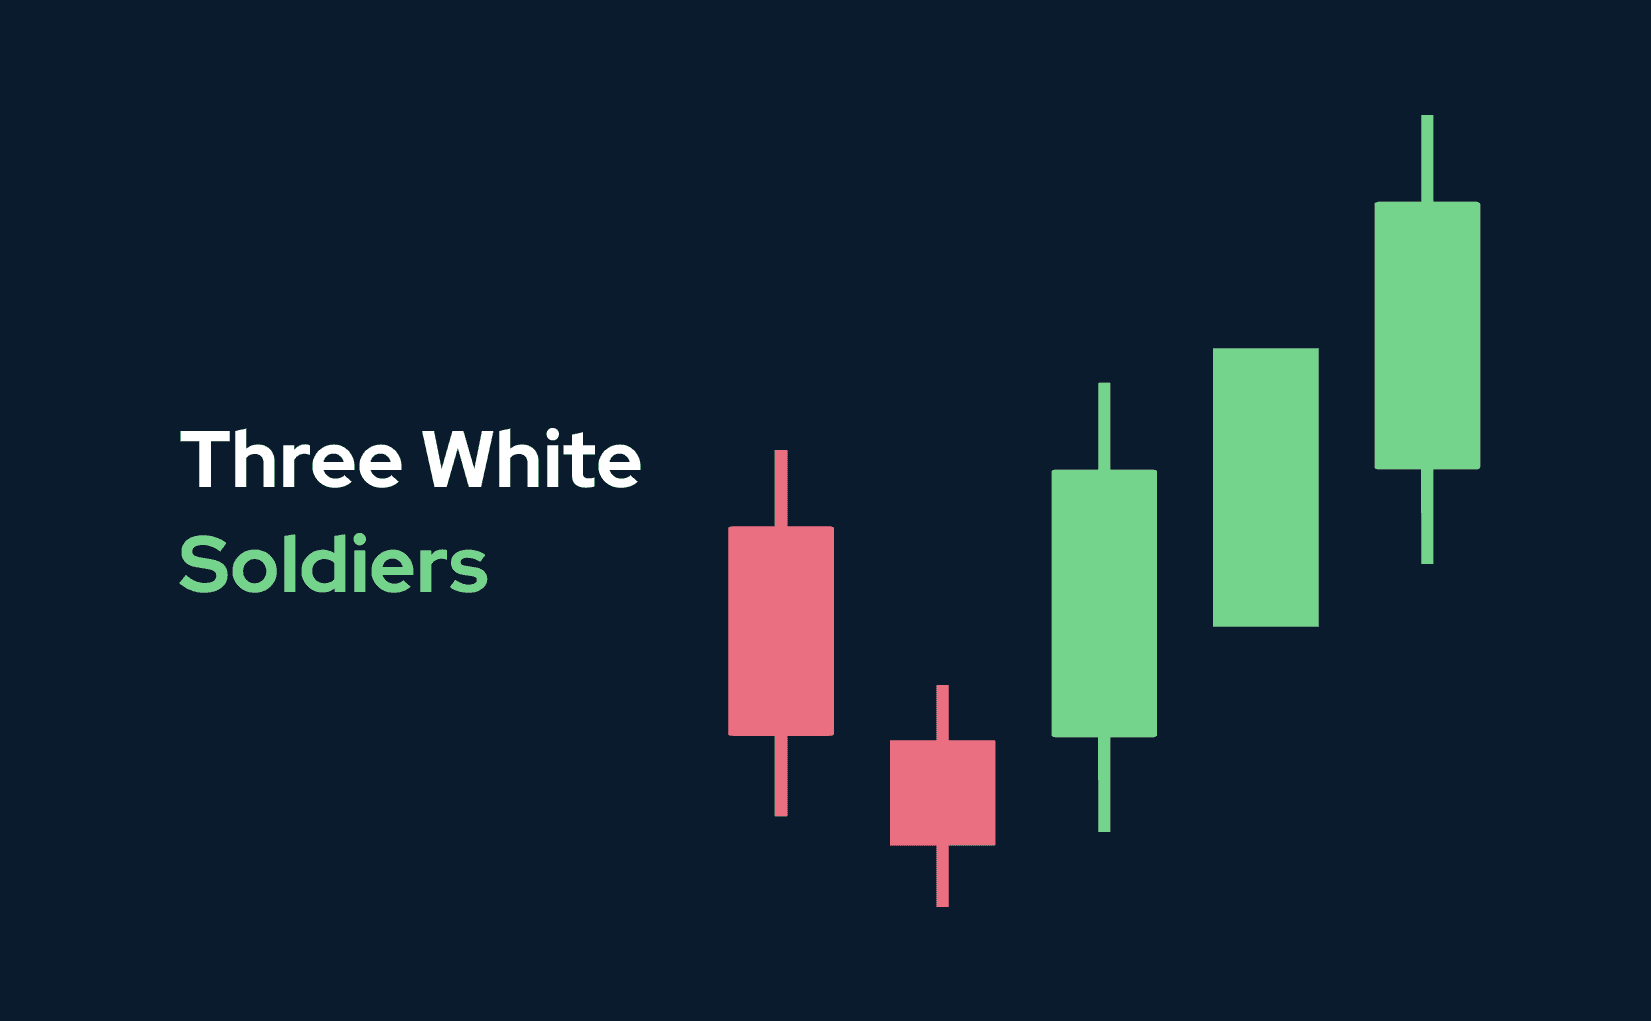
Three white soldiers pattern consists of three green candlesticks whose opening appears within the previous candlestick body and whose closing is above the highest point of the previous candlestick.
Candlesticks have short wicks meaning buyers continue pressuring the market and raising prices.
Bullish harami
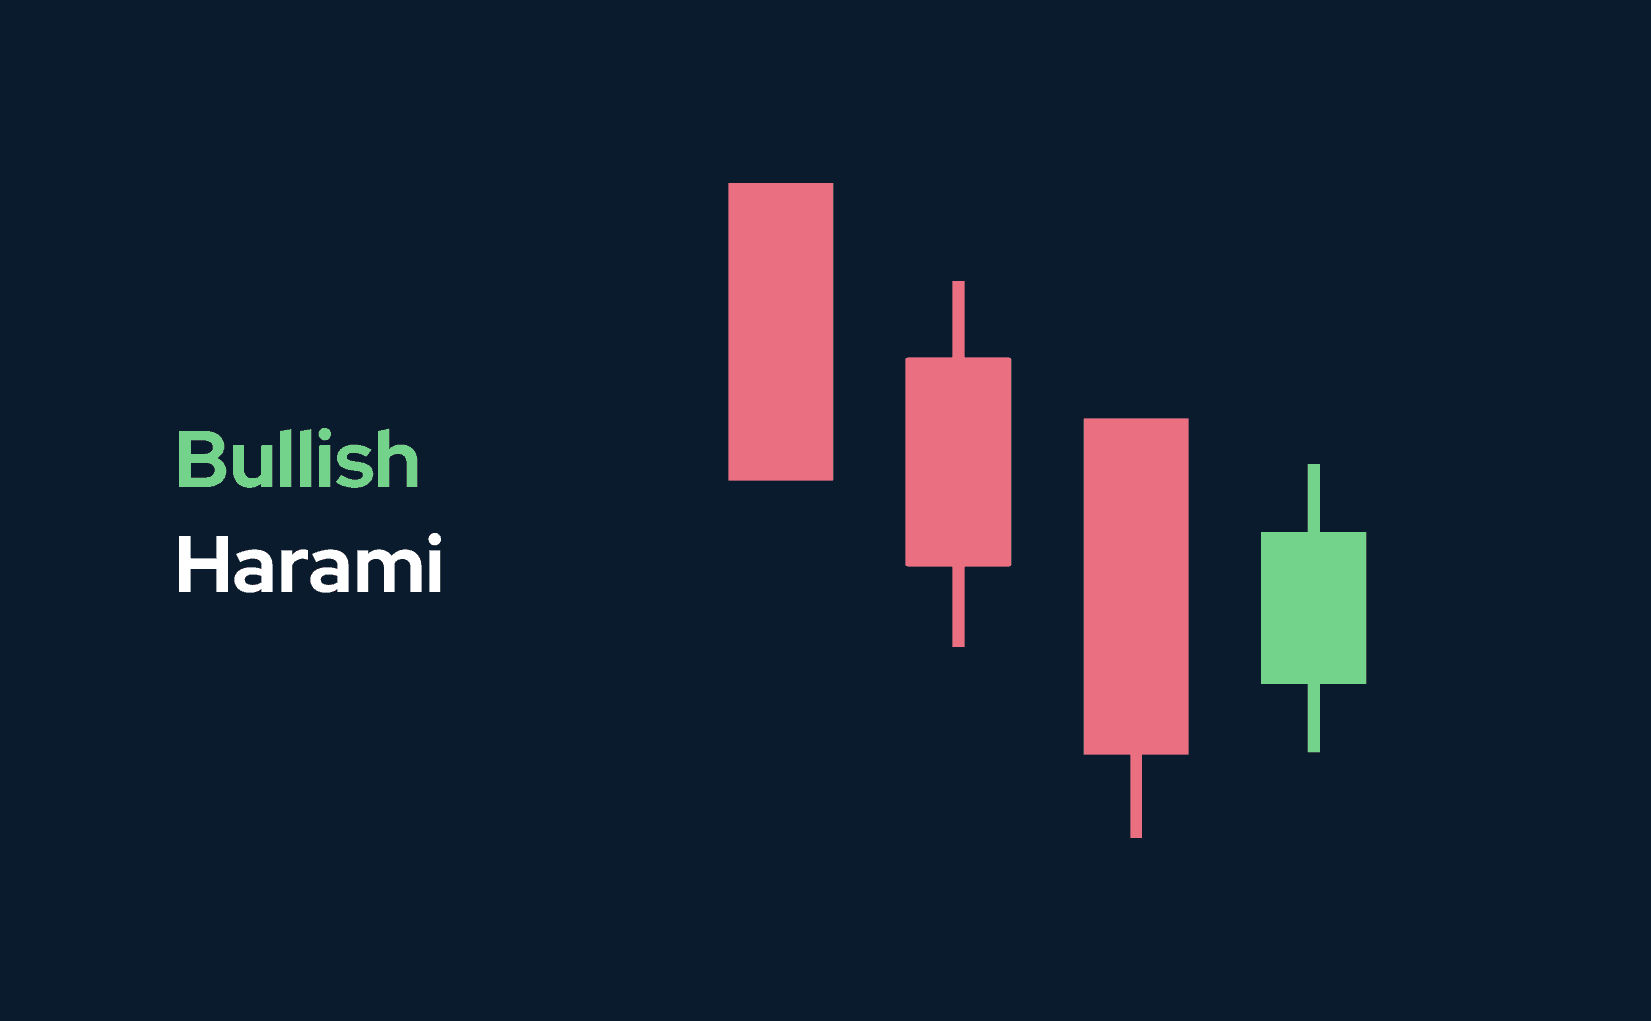
In bullish harami, a long red candlestick is followed by a short green one whose body and wicks are within the previous candlestick's body.
Bullish harami may show the end of the selling momentum.
Bearish Candlestick Patterns
A bearish candlestick pattern appears at the peak of the rising price chart and foregoes a price decline.
Hanging man
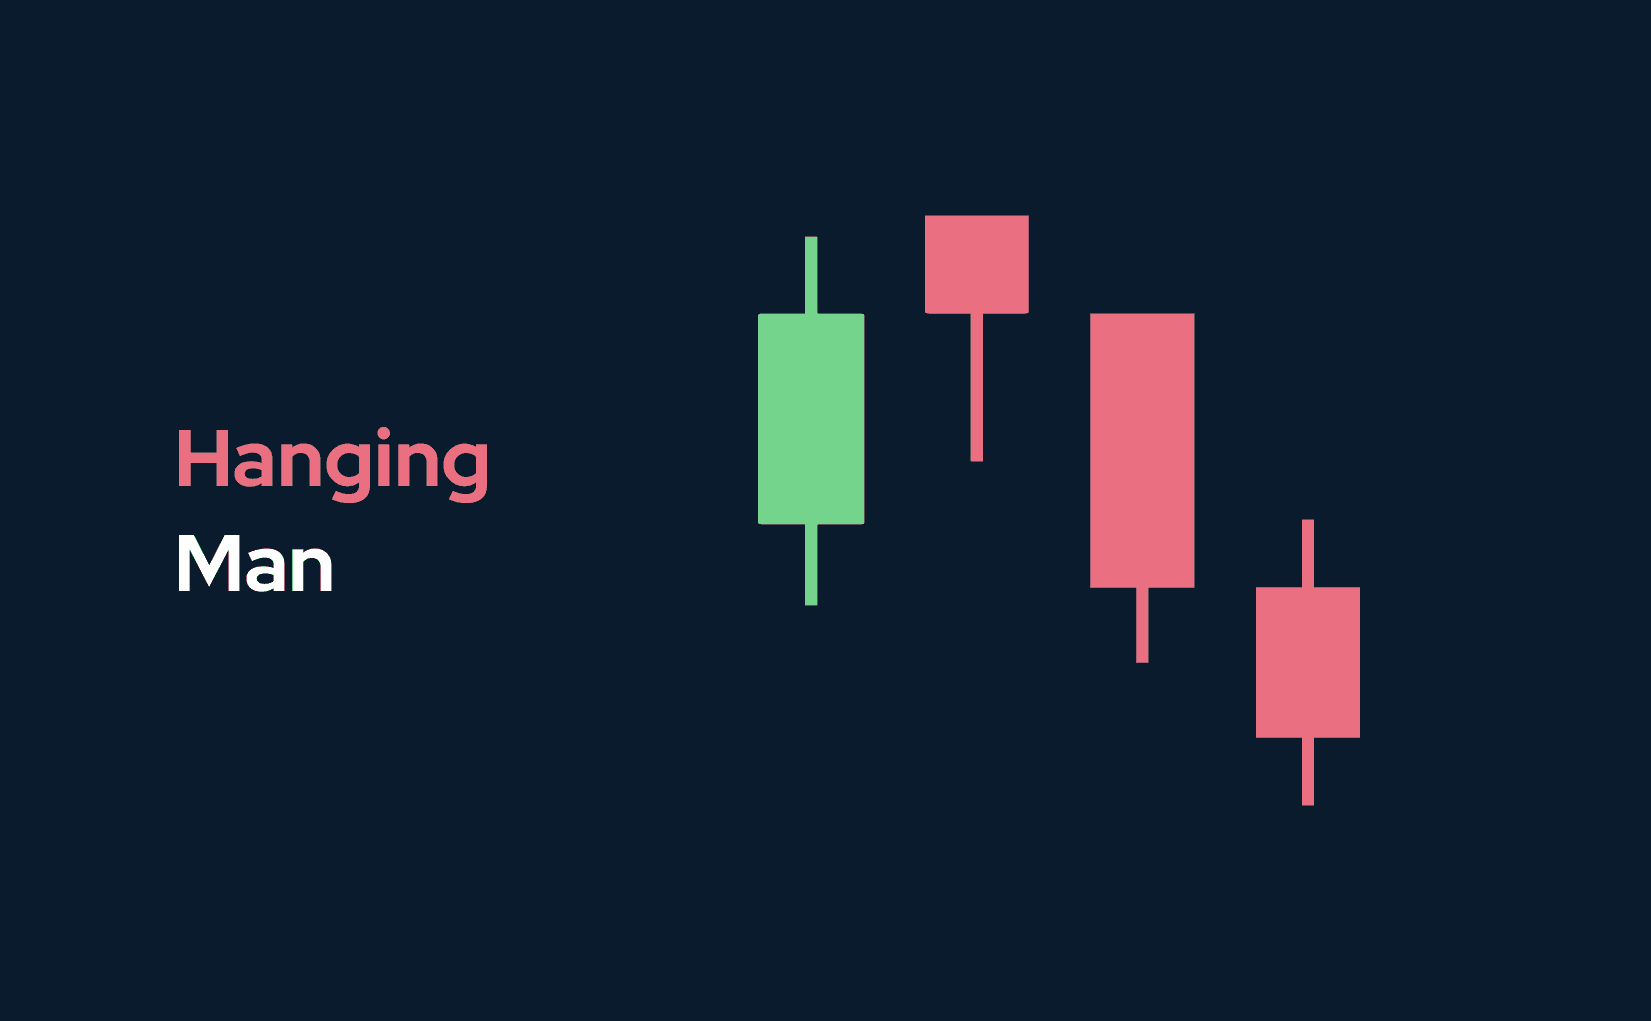
A hanging man appears at the end of the uptrend representing a bearish equivalent of a hammer with a short body and long down wick.
A hanging man pattern shows bulls are about to lose momentum in the market.
Shooting star
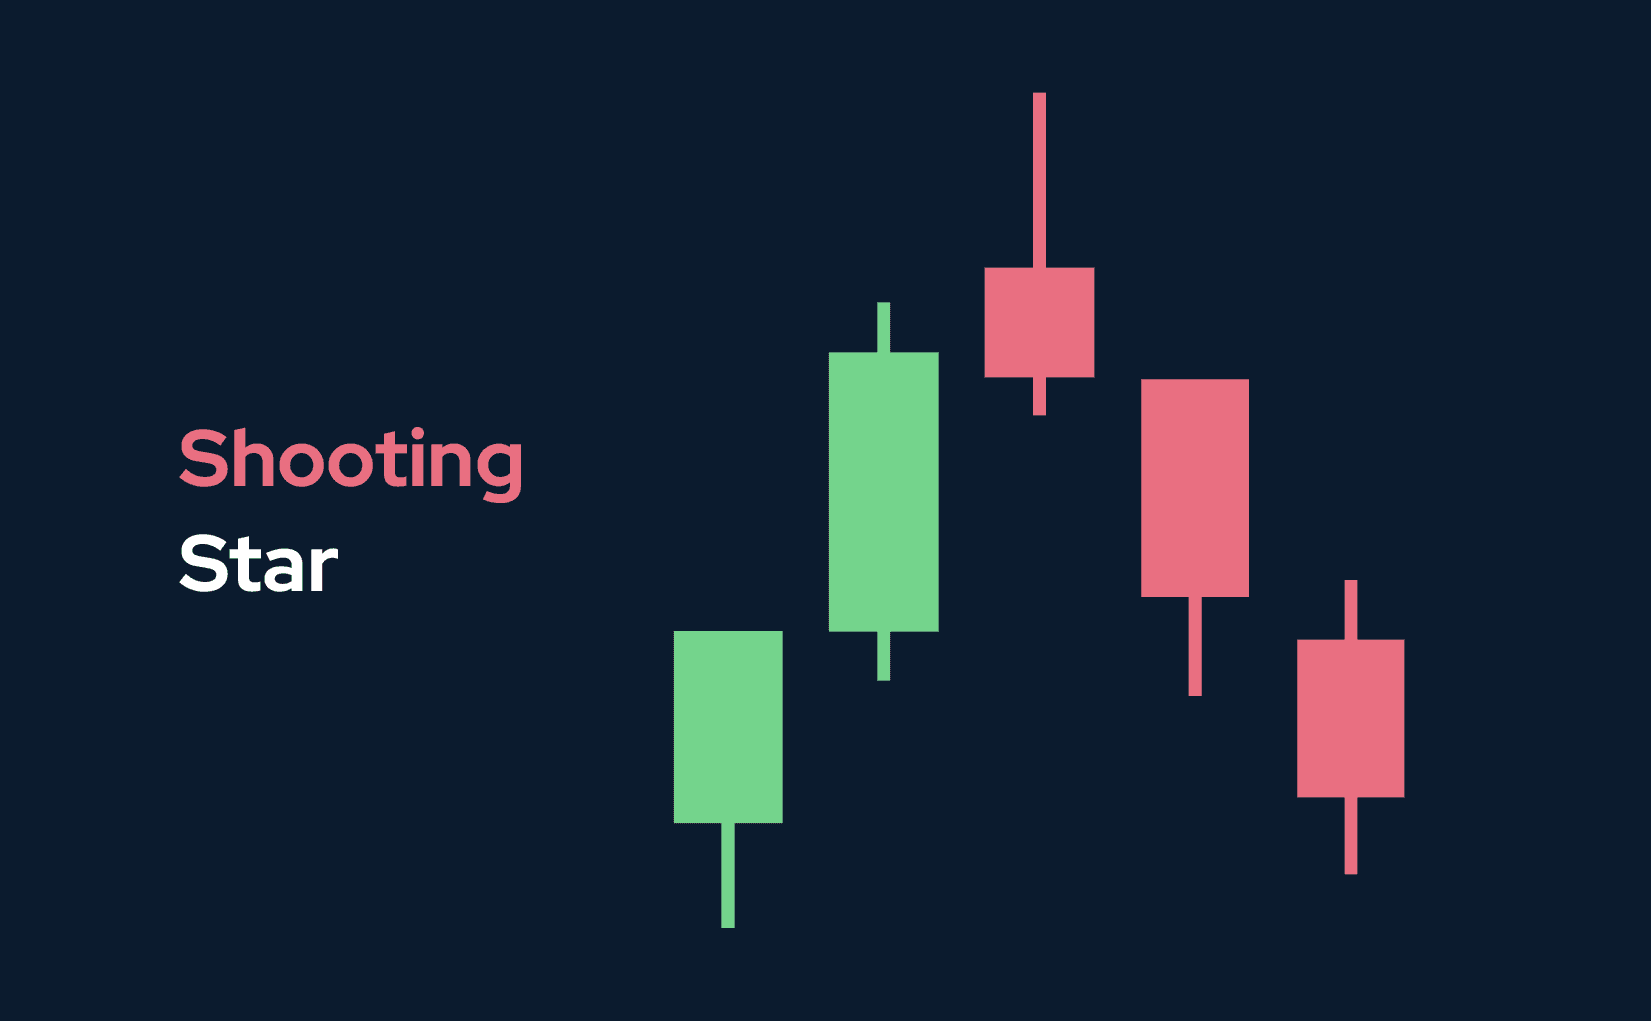
A shooting star appears at the end of the up trend as a red candlestick with a long top wick, a short or missing bottom wick and a small body.
The pattern shows the market reached its high and sellers dropped it down.
Three black crows
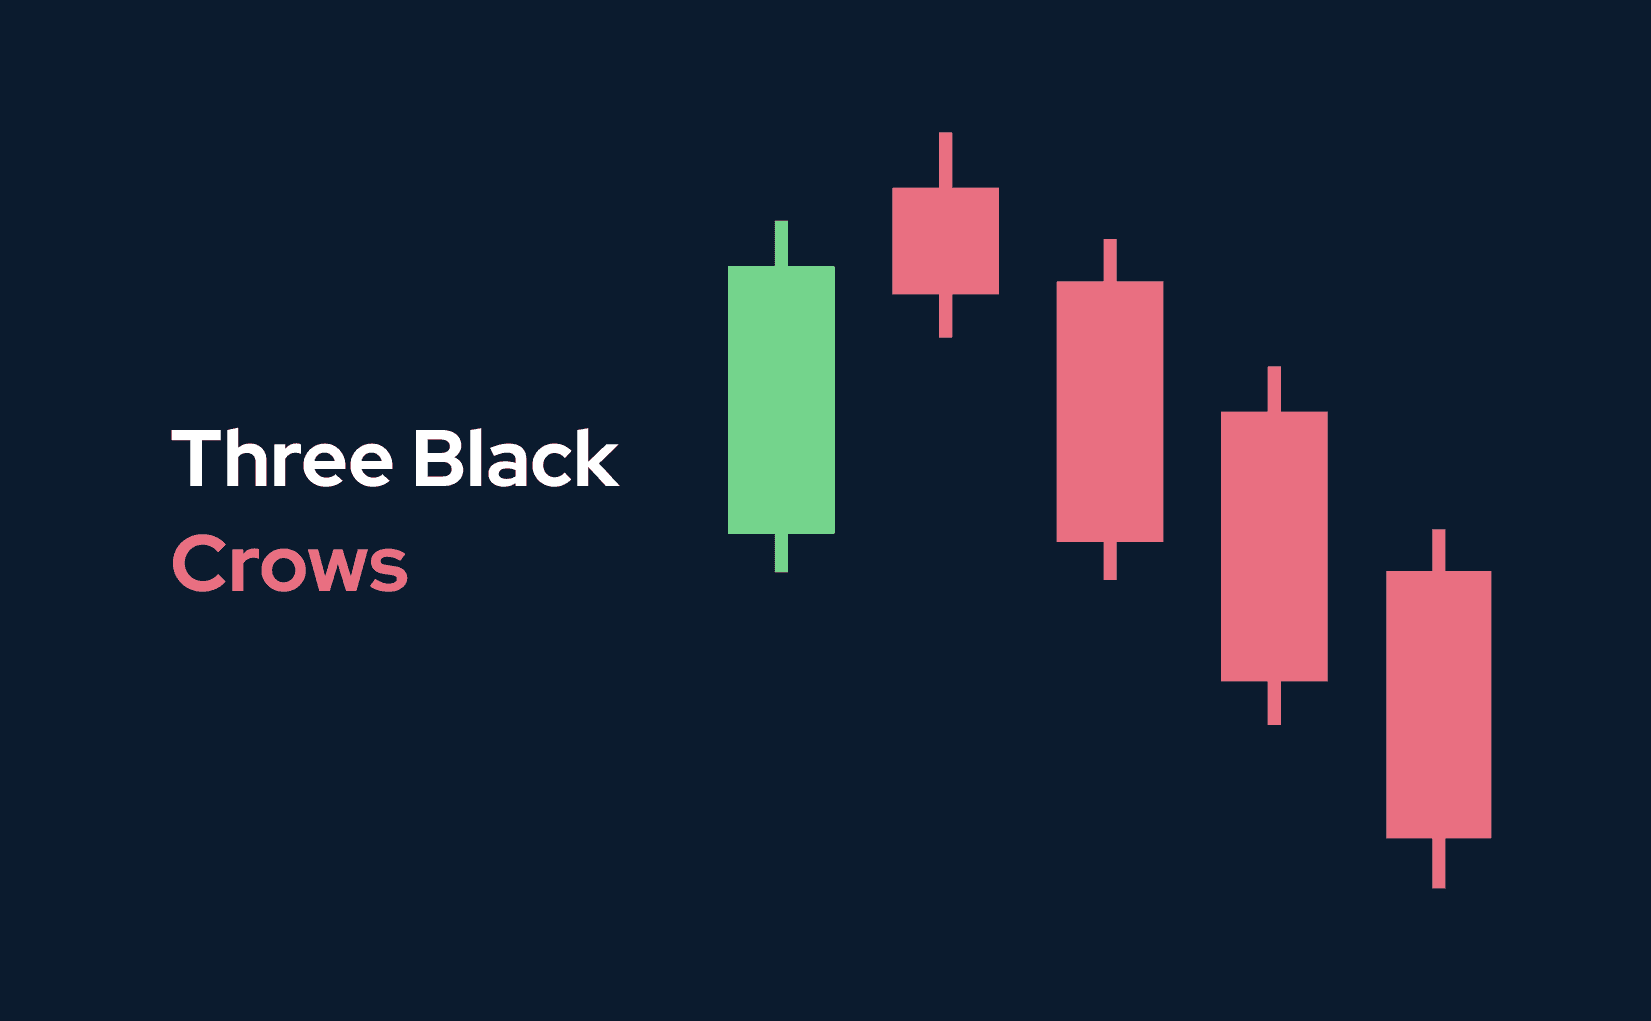
A three black crows pattern is a bearish equivalent of three white soldiers with three red candlesticks opening within the body of previous ones and closing down the lowest point.
Bearish harami
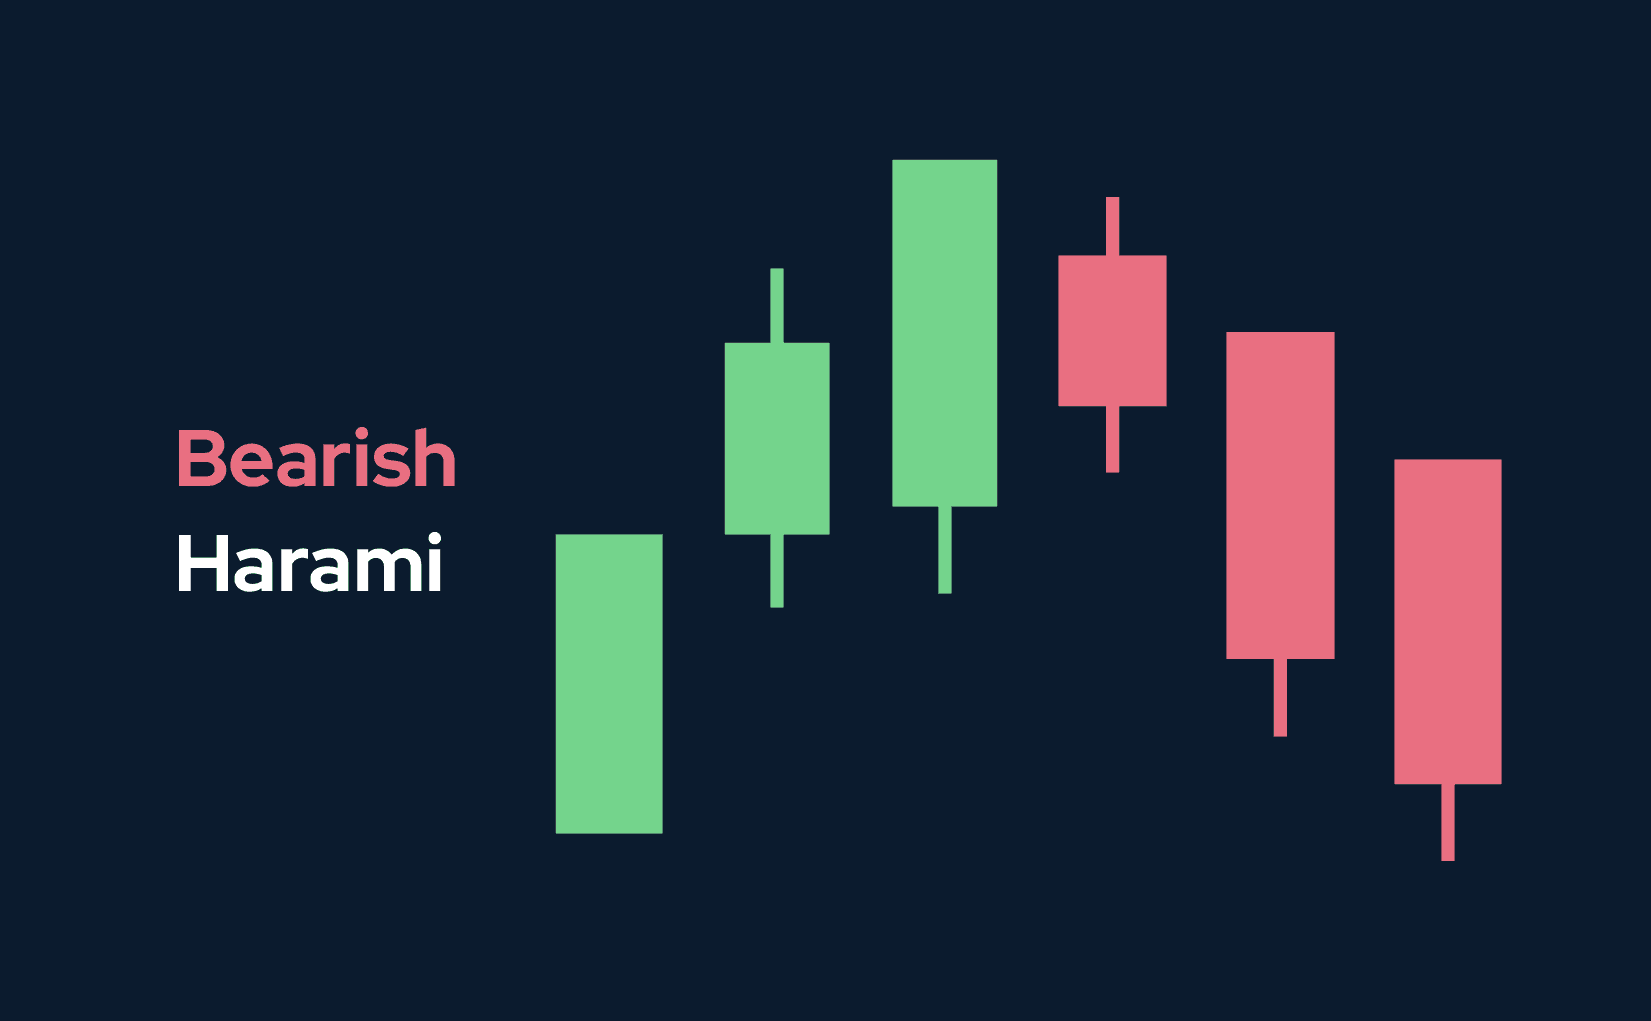
A bearish harami appears at the end of the uptrend and consists of a long green candlestick succeeded by a short red one with the body and wicks enclosed within the body of the prior candlestick.
Dark cloud cover
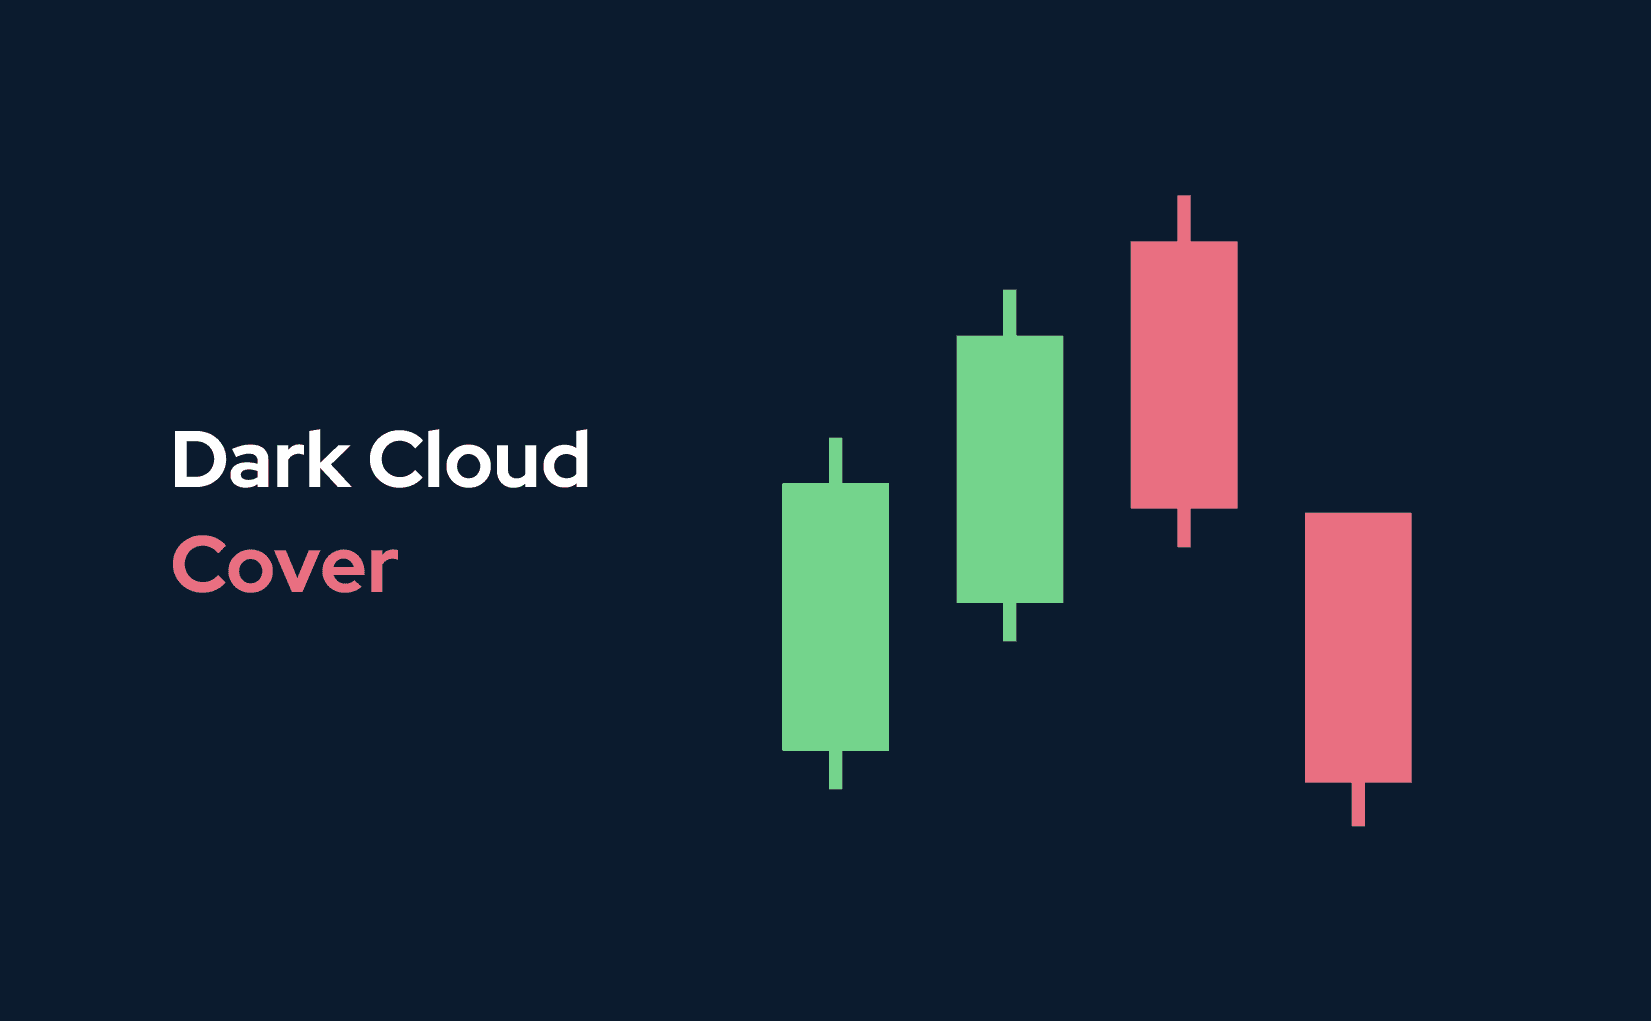
In a dark cloud cover, a red candlestick opens above the close and closes below the middle of the previous green candlestick.
In Conclusion
Candlestick patterns allow to understand market trends and are helpful for traders. However, your trading decisions can't rely on these indicators only, as the market may behave against the predictions of bearish and bullish candlestick patterns. You can combine candlestick charts with other technical analysis indicators to get more insights on price actions.